
Community Engagement Results
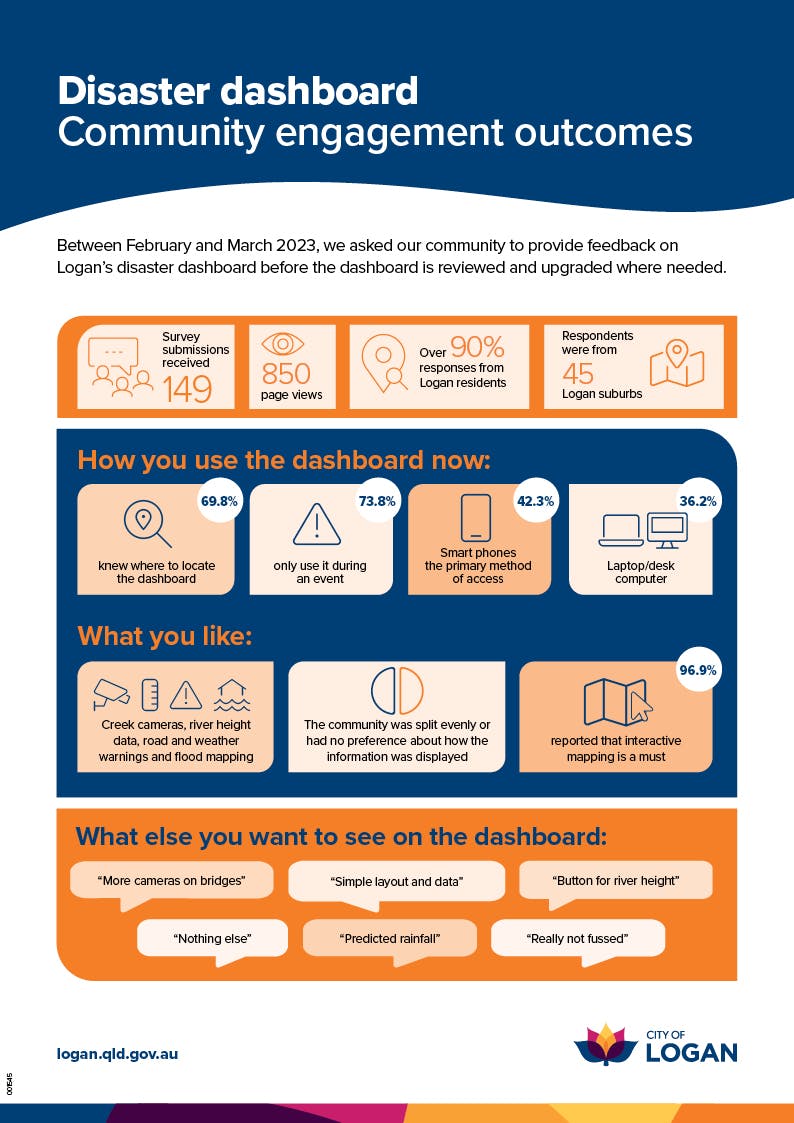
From February to March 2023, we asked our community to provide feedback on Logan's disaster dashboard before the dashboard is reviewed and upgraded where needed. The project page had almost 900 views and 149 surveys were completed. (90%) of responses are from Logan residents. (73.8) of respondents tend to use the dashboard the most during an event, (69.8%) of respondents know where to locate the dashboard, (42.3%) use their smartphone as a primary method of access, (36.2%) use their laptop/desk computer and (96.9%) of respondents like the idea of an interactive map. Respondents would also like creek cameras, river height data, road and weather warnings and flood mapping. Survey participants want to see more cameras on bridges, simple layout and data, button for river height and predicated rainfall.